-
E-mail
13384303373@163.com
-
Phone
13384303373
-
Address
No. 468 Yinjin Road, Jingyue High tech Development Zone, Changchun City, Jilin Province
Product Categories
- High-temperature extensometer
- Thermal expansion measuring instrument
- High and low temperature environmental chamber
- High temperature vacuum furnace
- Endurance creep testing machine
- force sensor
- Low temperature environment device
- Microscopic in-situ nanomechanical testing equipment
- Oil source pipeline system
- High temperature atmospheric furnace
- actuator
- Multi channel data acquisition controller
- Specialized component fatigue test bench
- impact testing machine
- vibration table
Changchun Deli Measurement and Control Test System Co., Ltd
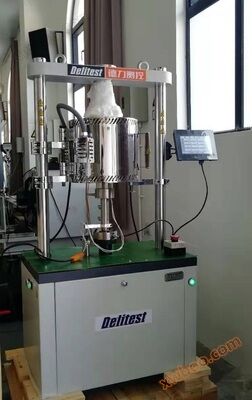
DKNZ in-situ torsion tester
NegotiableUpdate on 03/26
- Model
- Nature of the Manufacturer
- Producers
- Product Category
- Place of Origin
Overview
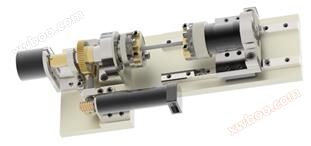
DKNZ in-situ torsion tester company has conducted a comprehensive analysis of the current development status and trends of material torsion testing equipment and in-situ monitoring technology both domestically and internationally. They have developed and produced in-situ torsion testers that are compatible with optical microscopy imaging equipment, including single axis in-situ torsion testers (Figure 1) and dual axis linkage in-situ torsion testers (Figure 5)
Product Details
DKNZ typeIn situ torsion tester
The company targetsA comprehensive analysis has been conducted on the current domestic and international development status and trends of material torsion testing equipment and in-situ monitoring technology. In situ torsion testers compatible with optical microscopy imaging equipment have been developed and produced, including single axis in-situ torsion testers (Figure 1) and dual axis linked in-situ torsion testers (Figure 5).
(a) Single axis in-situ torsion tester(b) Physical picture of single axis in-situ torsion tester
Figure 1 Single axis in-situ torsion tester application metal material alloy material ceramic materials bionic materials composite material The uniaxial in-situ torsion tester provides precise technical support for material preparation, life sciences, aerospace, and interstellar exploration. A compact single axis in-situ torsion tester has been developed, which is compatible with optical microscopy imaging equipment Realize dynamic in-situ observation of material micro deformation damage mechanism and microstructure evolution under load In depth study of the macroscopic mechanical behavior and microstructural evolution of materials Equipped with a control host, dedicated detection and control system, and supporting analysis and processing software The direct current hollow cup motor is used in conjunction with a precision planetary gear reducer and a precision worm gear transmission to achieve dynamic loading of the specimen. This loading method ensures that the testing device has sufficient torsional load and a wide loading rate Realize torsional loading of specimens in a quasi-static manner Obtaining higher quality images during in-situ observation can provide clearer and more accurate observation and analysis of microstructure The typical material uniaxial in-situ torsion test curve is shown in Figure 2; The in-situ observation image of the surface morphology of the test material is shown in Figure 3; The in-situ observation image of the metallographic structure during uniaxial in-situ torsion testing is shown in Figure 4. (a) Q235 steel torsion curve (b) Q235 steel torsion test curve under different processes
Features and advantages
advanced design
(e) 2A12 aluminum alloy torsion curve (f) H59 brass torsion curve (g) 2A12 aluminum alloy ± 150 ° cyclic torsion curve (h) 2A12 aluminum alloy ± 200 ° cyclic torsion curve
Figure 2 Typical material uniaxial in-situ torsion test curve
As shown in Figure 2, the repeatability of the torque angle curves for the four materials is very good, indicating that the in-situ torsion testing device has good testing repeatability. These four materials exhibited different torsional mechanical behaviors during torsion testing. Compared with 2A12 aluminum and H59 brass, 45 steel and Q235 steel both showed obvious yielding phenomena, but the strengthening phenomenon of Q235 steel was not significant. Compared to other materials, 2A12 aluminum experiences increased load fluctuations near fracture, indicating accelerated internal crack propagation.
Figure 3 In situ observation image of surface morphology of material (H59 brass)
As shown in Figure 3, the in-situ observation image of H59 brass during torsion shows that its fracture surface is relatively flat and there is no necking phenomenon, which is consistent with the characteristics of material torsion failure.
Figure 4 In situ observation image of metallographic structure of material (Q235 steel)
As shown in Figure 4, the metallographic observation images magnified 100 times and 200 times during the torsion test show that at 800 °, most of the grains are broken into fine strips under shear action, and the material surface is covered with cracks. The grain boundaries cannot be distinguished. When the torsion reaches 2000 °, the material is close to fracture.
Technical specifications of single axis in-situ torsion tester (single axis series NZ01, NZ02, NZP01, etc.)
Maximum load capacity: 100N • m, 200N • m (series)
Loading force resolution: 100mN
Twist angle resolution: 0.18 º
Range of torsional load: 1500N • mm
Resolution of torsional load: 0.1N • m
Force measurement accuracy: ± 1% indication
Displacement resolution: 1 μ m
Test speed range: 0-6.5/min
Displacement velocity accuracy: better than ± 0.5% (unloaded)
Speed load capacity: below 3mm/min, maximum allowable test torque
Sample size: millimeter level
(a) Commercial dual axis linkage in-situ torsion tester (b) Physical image of commercial dual axis linkage in-situ torsion tester
Figure 5 Dual axis linkage in-situ torsion tester
application
metal material
alloy material
ceramic materials
bionic materials
composite material
Features and advantages
The dual axis linkage in-situ torsion tester provides precise technical support for material preparation, life sciences, aerospace, and interstellar exploration.
We have developed a compact dual axis in-situ torsion tester that is compatible with optical microscopy imaging equipment
Realize dynamic in-situ observation of material micro deformation damage mechanism and microstructure evolution under load
In depth study of the macroscopic mechanical behavior and microstructural evolution of materials
Equipped with a control host, dedicated detection and control system, and supporting analysis and processing software
advanced design
After the motor is reduced by an integrated planetary gear, it is further reduced, increased in torque, and reversed by two-stage worm gears, achieving the output of large loads in a compact structure.
Realize torsional loading of specimens in a quasi-static manner
Obtaining higher quality images during in-situ observation can provide clearer and more accurate observation and analysis of microstructure
The in-situ torsion test curve of dual axis linkage is shown in Figure 6; The in-situ observation image of the surface morphology of the test material is shown in Figure 7; The in-situ observation image of the metallographic structure of the biaxial linkage in-situ torsion test is shown in Figure 8.

Figure 6 Two axis linkage in-situ torsion test curve
As shown in Figure 6 (a), the pre twist angle tensile test was conducted on 6061 aluminum alloy at a small angle. The results showed that under the pre twist angle, there was little plastic deformation and almost no effect on the tensile mechanical properties. When the twist angle was greater than about 30 °, the local deformation stage of the tensile test would appear earlier with the increase of angle, and the elongation rate would decrease.
As shown in Figure 6 (b). The time curves of rotation angle, torque, displacement, and tension for tensile tests conducted under pre torsion of 10 ° and 60 °, respectively. The curve indicates that regardless of the size of the pre twist angle, the torque generated will sharply decrease during the elastic stage of the tensile test, and then remain at a lower level until the specimen fractures.
As shown in Figure 6 (c), when twisting during the elastic and strengthening stages of stretching, the tension value will decrease, but the rate of decrease is relatively slow, and when twisting to 60 °, the tension will decrease to around 200N.
As shown in Figure 6 (d), there is only a slight change in the torsion test curve of the material (copper) specimen under pre tension displacement from 0mm to 0.04mm. Because under smaller pre tension loads, the material is in the elastic stage, and the pre tension displacement increases, resulting in a decrease in the cross-sectional size of the specimen, which is the dominant factor leading to a decrease in torsional strength.
Figure 7 In situ observation image of surface morphology of test material
As shown in Figure 7, the typical "cup-shaped" fracture of plastic materials can be observed from the two-dimensional and three-dimensional morphology of the tensile fracture. Under tensile stress, a triaxial stress state is formed in the necking area, and the axial stress in the center is the highest. After sufficient plastic deformation, defects such as dislocations continue to accumulate in the material, reaching a certain degree, and cracks are generated along the direction of shear stress, which extend from the outside to the inside until complete fracture.
Figure 8: In situ observation image of metallographic structure during biaxial linkage in-situ torsion testAs shown in Figure 8, the metallographic structure at a 90 ° angle shows that as the angle increases, the number and density of cracks also increase, while maintaining both parallel and perpendicular directions to the X-axis. Meanwhile, the slip phenomenon of the lattice is also more pronounced. The metallographic structure at a 180 ° angle, due to the increased curvature of the specimen plane, shows a virtual focus at the edges of the image, but the changes in the metallographic structure can still be clearly seen. The lattice slip is obvious, and the intersecting cracks in the lattice cause the lattice to break, and continuous long cracks gradually appear between multiple lattices.
Technical specifications of dual axis linkage in-situ torsion tester (dual axis series NZ01, NZ02, NZP01, etc.)
Maximum load capacity: 100N • m, 200N • m (series)
Loading force resolution: 100mN
Twist angle resolution: 0.18 º
Range of torsional load: 1500N • mm
Resolution of torsional load: 0.1N • m
Force measurement accuracy: ± 1% indication
Displacement resolution: 1 μ m
Test speed range: 0-6.5/min
Displacement velocity accuracy: better than ± 0.5% (unloaded)
Speed load capacity: below 3mm/min, maximum allowable test torque
Sample size: millimeter level
Similar Product Recommend